Data Driven Money

Live. Work. Retire. Smart.

How to Use Python to Calculate Mortgage Amortization

Using Python to Calculate Home Mortgage Loan Amortization for Beginners

Table of Contents

Where and How to Use Python: Google Colab

Finding a way to use Python can be as complex as you want it to be. You can set up an Anaconda Environment and install all the require dependencies ( see here for details) or you can use a python environment in the cloud. For this tutorial I have used the latter. I have used a Python Notebook in Google Colab.

Google Colab is free and will allow you to use storage, RAM, and CPU resources on Google’s servers. Using a Notebook set up will allow you to type code in blocks or chunks that can executed separately. Most importantly, Python dependencies have already been figured out and most packages are already made available. Packages that aren’t in Google’s catalog can be easily downloaded and installed remotely just as if you were running a local instance.

Python Notebook Setup

Once you get to the Google Colab link above or startup a local instance of Python through a console or your Notebook you will be ready to start getting some code written.

First, we will need to import the proper libraries. For calculating the amortization of a loan we will only need 2 packages (pandas and numpy). For presenting the data into a graphical form we will use 2 additional packages (matplotlib and seaborn).

The last line of code is used to ensure that some of the print statements work properly. Occassionally, Pandas likes to step in for our float variables… to keep things concise we will force it to print only two number past the decimal when the round method does not work.

				
					# import the appropriate libraries

# need these for data manipulation
import pandas as pd
import numpy as np

# need these for plotting
from matplotlib import pyplot as pyplot
import seaborn as sns

# Format money columns to two decimal places in pandas
pd.options.display.float_format = '{:6.2f}'.format


Configuring Loan Variables

Below you will see the code block we will use to configure the financial parameters of the mortgage loan amortization. For this formula we will need to define the following before we can begin:

  • Principal (P): The Starting Amount of the Loan
  • The Interest Rate (r): This is the Annual Percentage Rate or APR of the Loan
  • The number of Years (n): This is the total number of years of the loan
  • The number of Periods per Year (t): If you are making monthly payments this is just 12

Calculating Total Mortgage Loan Monthly Payment

Now that we have defined our input variables above it is time to calculate the periodic (in this case monthly) payment amount for the mortgage. We will store this amount into the variable A. We will also include the combined amount that will be paid towards both principal and interest each month. The formula for this compounded annually is:

A = Principal x (1 + interest) ^ years / ((1 + interest) ^ years)

To get a more accurate figure we will modify the above formula to compound on each period. Small numbers over 15 or 30 years can add up, and since this is a trivial calculation for a computer lets go ahead and use the more complicated formula.

A = Principal X (interest / period) X (1 + interest / period) ^ totalPeriods / ((1 + interest / period) ^ totalPeriods)

Using the ‘power’ function from Numpy library, the code block does this calculation in one line and stores it. The final amount paid monthly for a $250,000 loan at a rate of 3% over 30 years is $1,054.01.

				
					A = P * (r / t) * np.power((1+(r/t)), (n*t)) / (np.power((1+(r/t)), (n*t))-1)

# Format our Monthly Amount, A to just two places of precision
# And print out to the screen
print("Mortgage Loan Details")
print("-----------------------------------")
print("Principal:                 $", P)
print("Interest Rate (APR):       $", r)
print("Number of Years:            ", n)
print("Number of Periods Per Year: ", t)
print("-----------------------------------")
print("Periodic Payment:          $", A.round(2))


Splitting up Interest and Principal Over Time

As you can see above, calculating the monthly payment for a home loan with principal and interest is fairly straightforward. Moving forward, lets figure out the composition of each payment. We know each payment is 1 part interest and 1 part principle. Each payment changes over time. As you pay more and more principal, the amount of interest charged for the remainder goes down. Thus, by the time you get to your last payment it is composed of nearly all principal.

Since we know A, the total amount of each payment and we have stated above that A = Interest + Principal we should be able to make a few quick calculations to fill in the gaps… after all, we know the interest charged each period as well for the first monthly payment:

interest for first period = (APR / periods per year) x principal

Thus, in Python we would calculate it as:

				
					# calculate the first month's interest component
firstMonthInt = (r / t) * P
print("Interest Component of First Payment: $", firstMonthInt)


Executing the code above results in $625. Thus $625 of the $1054.01 total payment is composed of Interest. Thus, the principal paid down during this month is:

$1,054.01 – $625 = $429.01

Subtracting $429.01 from the principal left over and reoccurring the above code block would result in the second months interest component. The amount that is returned is $623.93. We can iteratively calculate the interest and principal components of each months payment. We can store all of this information either to make a tabular chart, graph or for reference. Oftentimes mortgage companies will mail you your ‘Amortization Schedule.’ This is how they calculate how much you pay (less any taxes, insurance, or escrow that you may owe on top).

				
					# calculate the second month's interest component
secondMonthInt = (r / t) * (P - 429.01)
print("Interest Component of Second Payment: $", secondMonthInt)


For the next code block below we are going to implement a ‘for loop’ to conduct that iterative calculation discussed above. We will store the results in a pandas DataFrame for various uses later.

				
					# Now its time to calculate each and every interest and principal component
# and then store them into a pandas dataframe called 'payments' with columns
# for each component and the period. To make things easier, we will also store
# the accumulated totals for both interest and principal

# prepare a DataFrame
payments = pd.DataFrame(columns = ['Period', 'PrincipalComp', 'InterestComp',
                                   'PrincipalAccum', 'InterestAccum'])

# calculate total periodic payment amount once more
A = P * (r / t) * np.power((1+(r/t)), (n*t)) / (np.power((1+(r/t)), (n*t))-1)

# initialize first row to 0. We will need to reference
# the value of principal to subtract in the first iteration
# that amount should be 0 since we want to calculate interest
# on the full principal during the first month
payments =  payments.append({'Period': 0, 
                             'PrincipalComp': 0,
                             'InterestComp': 0,
                             'PrincipalAccum': 0,
                             'InterestAccum': 0},
                            ignore_index = True)

# iterate through each period and find that periods components
# there are t x n periods (e.g. months * years). We will add a
# plus 1 since for loops don't include the last number to iterate 
# through
for i in range(1,t*n+1):
  Period = i 

  # calculate component values for interest and princpal
  InterestComp = (r / t) * (P - payments['PrincipalAccum'][i-1])
  PrincipalComp = A-InterestComp
  
  # calcualte accumulated values for interest and principal
  PrincipalAccum = payments['PrincipalAccum'].iloc[i-1] + PrincipalComp
  InterestAccum = payments['InterestAccum'].iloc[i-1] + InterestComp

  # store the results
  payments =  payments.append({'Period': Period, 
                               'PrincipalComp': PrincipalComp,
                               'InterestComp': InterestComp,
                               'PrincipalAccum': PrincipalAccum,
                               'InterestAccum': InterestAccum},
                             ignore_index = True)

# change our period to an integer instead of a float
payments['Period'] = payments['Period'].astype('int')

# print out the results
payments


DataFrame of the Mortgage Amortization

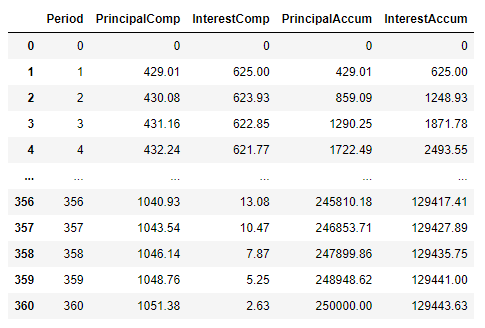
As we can see above, we now have a nice and tidy 361 row mat

rix of all of our interest and principal payments. We can easily export this data to excel using the following command:

 payments.to_exce

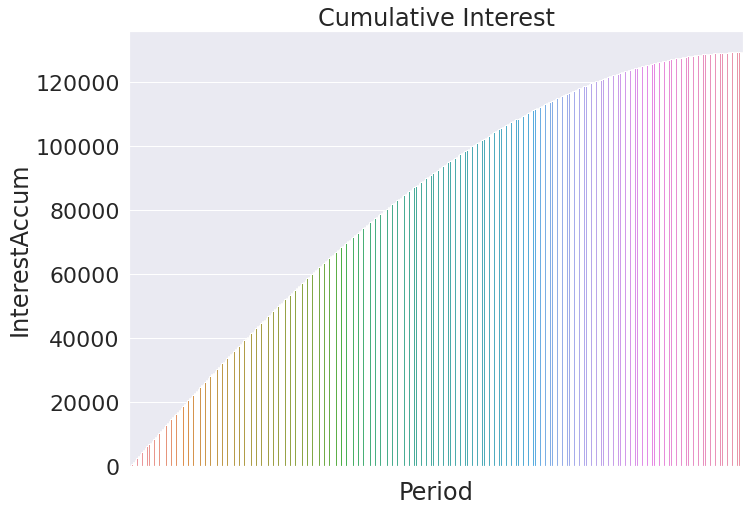
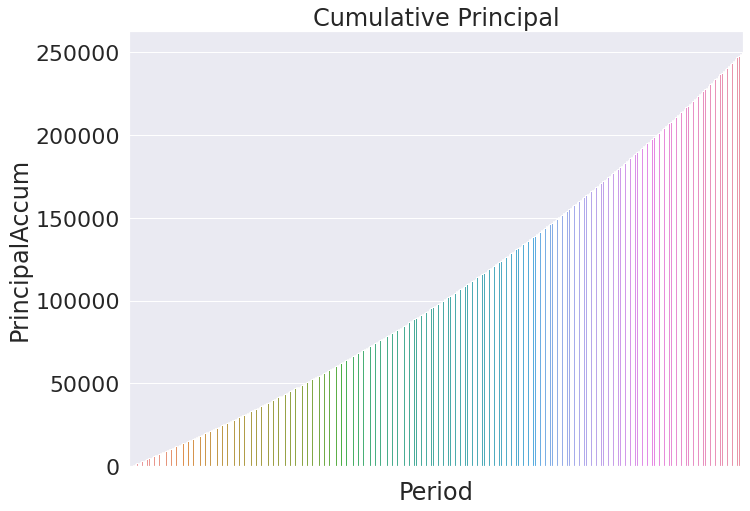
Obviously, if our initial loan was for $250,000 then our final total amount of principal paid should be the same amount… we can confirm this is true above. The total amount of interest paid, a more exciting number, is $129,443.63 for a 3% loan amortized over 30 years. Not so bad. We have all the data we need to plot out our payments and interest.l(‘payments.xls’) The last row of the DataFrame also tells us the cumulative interest and principal paid.

				
					# plotting out cumulative interest over the course of the loan

sns.set(rc={'figure.figsize':(11,8)}) # make the graph readably large
sns.set_style('whitegrid') # change the background grid
sns.set_palette('Greens') # hange the color scheme

sns.set(font_scale = 2) # make titles and axis names larger

# now for the actual plot
interest = sns.barplot(data = payments, x ='Period', y = 'InterestAccum').set_title('Cumulative Interest')
interest.axes.xaxis.set_ticklabels([]) # too many ticks to be readable (360 of them) so get rid of it


Python Created Bar Chart of Amortized Interest

				
					# Plotting out cumulative principal
principal = sns.barplot(data = payments, x ='Period', y = 'PrincipalAccum').set_title('Cumulative Principal')
principal.axes.xaxis.set_ticklabels([]) # too many ticks to be readable (360 of them) so get rid of it


Python Created Bar Chart of Amortized Principal
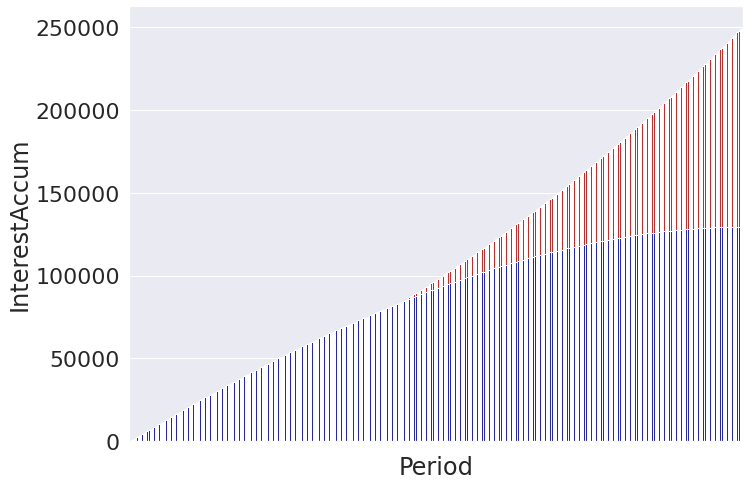
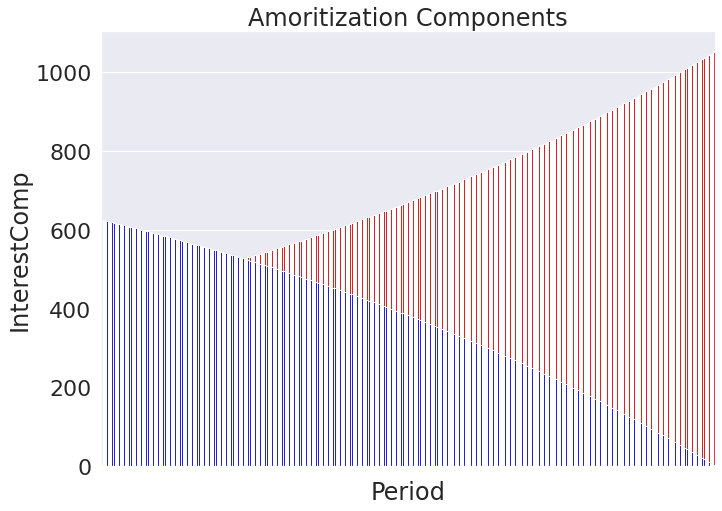
Now lets plot both on top of each other using the same type of bar chart.

				
					# Plotting both cumulative interest and principal on same chart
principal = sns.barplot(data = payments, x ='Period', y = 'PrincipalAccum', color = 'red')
interest = sns.barplot(data = payments, x ='Period', y = 'InterestAccum', color = 'blue').set_title('Cumulative Amoritization Totals')
interest.axes.xaxis.set_ticklabels([]) # too many ticks to be readable (360 of them) so get rid of it
principal.axes.xaxis.set_ticklabels([]) # too many ticks to be readable (360 of them) so get rid of it


Python Created Bar Chart of Amortized Interest & Principal
Now let’s see how the composition of the individual payments change over time. In theory the payment should skew more and more towards the principal since we have a smaller balance to pay interest and the monthly payment remains unchanged. The below chart should show the blue component going towards 0 while the principal peaks near the full monthly payment amount.

				
					# Plotting both interest and principal components
principal = sns.barplot(data = payments, x ='Period', y = 'PrincipalComp', color = 'red')
interest = sns.barplot(data = payments, x ='Period', y = 'InterestComp', color = 'blue').set_title('Amoritization Components')
interest.axes.xaxis.set_ticklabels([]) # too many ticks to be readable (360 of them) so get rid of it
principal.axes.xaxis.set_ticklabels([]) # too many ticks to be readable (360 of them) so get rid of it


Python Created Bar Chart of Amortized Components Scatter Plot
To make things easier lets see if we can use some type of line. Since we have many points that we can plot we can just use a scatter plot. The 360 rows of values should make the plot appear line like. Notice the blue dot at the bottom left that marks where we initialized our DataFrame to make our for loop work. By plotting it this way it is easier to see how the payment values change even when their values overlap.

				
					# Plotting interest and principal components as a scatterlot
principal = sns.scatterplot(data = payments, x ='Period', y = 'PrincipalComp', color = 'red')
interest = sns.scatterplot(data = payments, x ='Period', y = 'InterestComp', color = 'blue').set_title('Amoritization Components')
interest.axes.xaxis.set_ticklabels([]) # too many ticks to be readable (360 of them) so get rid of it
principal.axes.xaxis.set_ticklabels([]) # too many ticks to be readable (360 of them) so get rid of it


Python Created Bar Chart of Amortized Components

Other Considerations:

So far in this article we have been able to calculate the monthly payment for a mortgage given the interest rate, principal, and time constraints. We then were able to graphicly discern how the payment is comprised of changing values for both the interest and principal despite the monthly payment remaining static. But there are other major considerations when discussing the amortization of a mortgage that should not be left out of the discussion.

PMI – Private Mortgage Insurance

Private mortgage insurance is a policy that you may have to pay on top of your principal and interest payment if you have a conventional loan. Typicall,y you only have to pay this if you did not put down at least 20% in cash as a down payment. If you have a VA loan, then this does not apply. Don’t forget to add this to your monthly amount if it applies to you.

Property Taxes

Property taxes can be a big deal depending on where you live. What state and whether you live inside city limits can change the amount you pay monthly quite dramatically. That said, you should talk to your mortgage broker or accountant to get a better idea how much this is so you can factor it into your calculations. Property taxes can often be larger than the interest you pay on your mortgage and can vary so much that a few miles difference can make the difference on whether you can afford a specific home or not so watch out.

Escrow

Many additional loan contingencies may require you to pay into an escrow. Sometimes the escrow account is the party that will be paying your property taxes or other fees mentioned already. Either way, you will need to get at least an estimate of what these fees will be and what your bank will require you to pay through your escrow. Only your bank can do this since they set the requirements. Usually, you will be paying into your escrow at the same time you are making your normal house payments.

HOA and COA Fees

Homeowners’ Associations (HOAs) or Condo Owners’ Associations (COAs) also usually levy a fee. Sometimes it is paid annually, semi-annually or for more expensive operations monthly. Don’t be caught off guard. For condos especially, HOA/COA fees can run into the 1,000s of dollars a month depending on the specific dynamics of the property you are looking at.

Home Maintenance

Using Python to Calculate Home Mortgage Loan AmortizationMaintenance is also something that needs to budgeted for. Although you will not likely need to pay anyone a set fee, it is a good idea to set aside some money each month into a low-risk account such as a savings account in the case you have an emergency repair. The contract language in your mortgage agreement likely requires you to make major repairs in a timely manner… saving ahead of time will help ensure that you keep on top of an unexpected outflows to your budget.

Conclusion and Financial Warning

Calculating your mortgage amortization is a great way to understand what underpins what is likely the largest purchase you will ever make. Additionally, it allows you to build the code necessary to start modeling out other parameters such as making additional lump sum payments each month. We’ll cover the additional things you can do with Python as it pertains to your mortgage in our next article. We’ll link it here once its complete.

All that said, understand that I have written this article as an expression of my opinion only. Please do your own research. Hire a qualified Financial Advisor, Mortgage Broker, or Accountant to give you specific advice tailored to your exact situation. Upon publishing this article, I am not aware of any coding mistakes… but I do make them… and I make them a lot. Please use the code at your own risk and reach out to me if you have any ideas down in the comments section or by email.

Guy Money

As a formally trained Data Scientist I find excitement in writing about Personal Finance and how to view it through a lens filtered by data. I am excited about helping others build financial moats while at the same time helping to make the world a more livable and friendly place.

Leave a Reply

Your email address will not be published. Required fields are marked *

Scroll to top